The Widening Gap: A Decade of Humanitarian Funding Shortfalls
From $19B requested to $57B, and fewer cents on every dollar. Here's what the data shows, and what your team can do about it.
When I look at humanitarian funding data over the past ten years, one trend stands out above everything else: the gap between what is needed and what actually arrives has not just grown, it has accelerated. And 2025 is shaping up to be the worst year yet.
This is not an abstract budget problem. Behind every unfunded dollar are clinics that never opened, food distributions that stopped short, and protection programs that closed mid-crisis. For MEL and program teams, understanding this trend is not optional. It shapes everything from indicator design to budget contingency planning.
Let me walk through the numbers, and then talk about what teams can actually do.
A Decade of Growing Needs, Stagnating Resources
In 2014, the global humanitarian system requested roughly $19 billion through UN-coordinated appeals. About 65% of that was covered. That already felt like a significant gap, but it was manageable by historical standards.
Fast-forward to 2023. Response requirements hit record highs, and Development Initiatives' flagship Falling Short? Humanitarian Funding and Reform report confirms that total international humanitarian assistance reached $43.4 billion, a historically high nominal figure [1]. But needs had grown far faster. The result: a shortfall of $32 billion, the largest on record [2]. The funding ratio had fallen to roughly 40%, meaning that for every dollar requested, only about 40 cents arrived.
That is not a funding crisis. That is a structural failure of the funding model.
📝 Note: The $43.4 billion figure represents total international humanitarian assistance, not just UN-coordinated appeal funding. The appeal-specific funding ratio (requirements vs. contributions) is typically lower, making the gap even starker within formal humanitarian response plans.
To put the arc in plain terms: needs roughly tripled over the decade, while funding less than doubled, and then actually declined. According to Development Initiatives, total humanitarian assistance dropped by 1.1% in 2023 compared to 2022, even as the number of people requiring aid reached 311 million [1]. And projections for 2024 pointed to a further decline [3].
The Donor Dependency Problem Makes It Worse
The aggregate numbers are alarming enough. But the structural fragility underneath them is what keeps me concerned for the medium term.
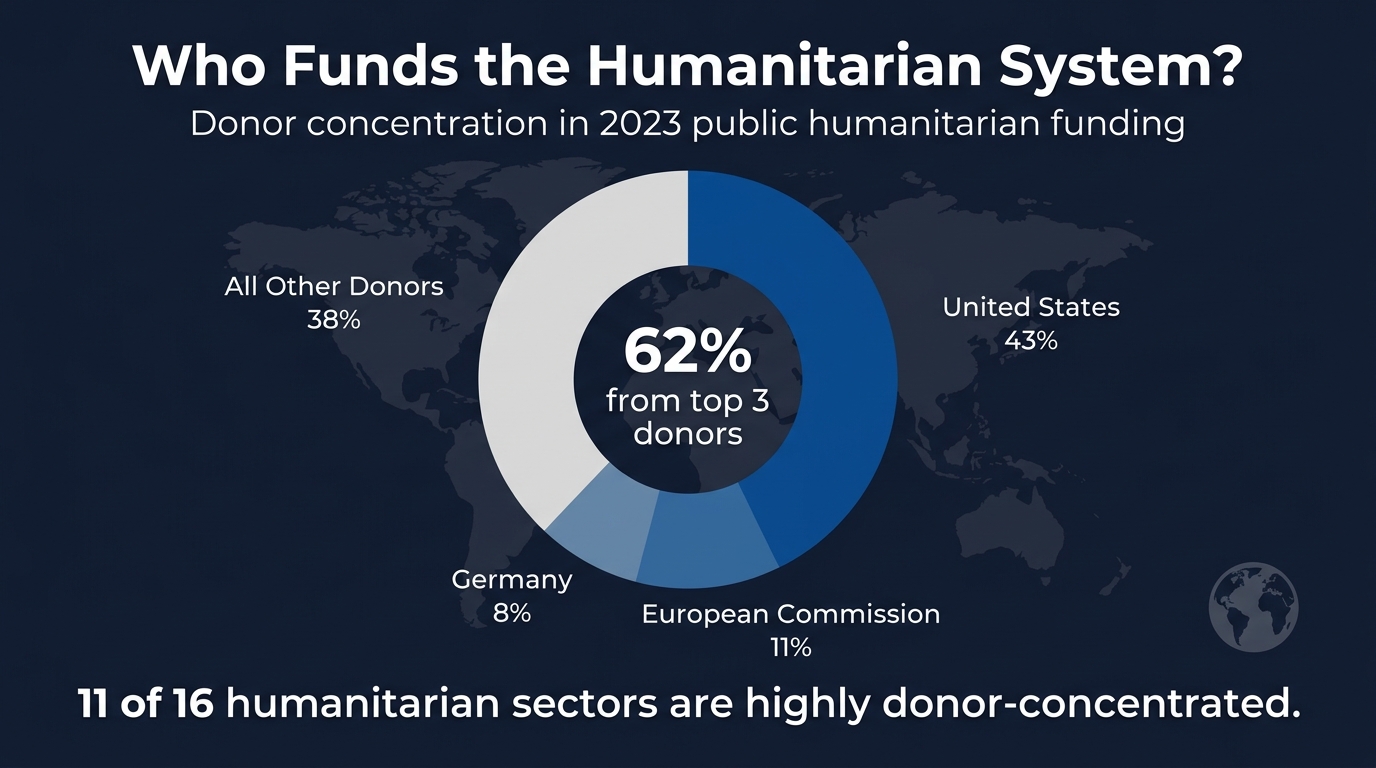
The New Humanitarian's analysis of 2023 public humanitarian funding data reveals that the top three donors (the United States, European Commission, and Germany) contributed 62% of all public humanitarian funding [4]. The United States alone accounted for 43% of government donor funding, up from roughly 39% a decade earlier [4]. Eleven of sixteen humanitarian sectors are classified as highly donor-concentrated, meaning the top three contributors make up more than half of sector-specific funding [4].
This is a fragile architecture. When one major donor shifts policy, the entire system shudders.
Which is exactly what happened in early 2025. The U.S. government's abrupt multi-billion-dollar cuts to foreign assistance funding threw an already overstretched system into chaos [5]. The Women's Refugee Commission documented the cascading effects: maternal healthcare programs shutting down, schools closing, safe spaces ceasing to operate, and protection systems collapsing for women and girls in active crises [5]. These were not hypothetical risks. They happened within weeks of the cuts being announced.
⚠️ Warning: If your program's budget is more than 30-40% dependent on a single government donor, the 2025 U.S. aid cuts are a stress test you should take seriously, regardless of whether you receive U.S. funding directly. Downstream contracting chains mean the exposure is often invisible until it materializes.
Wiley's Global Policy also flags that shrinking contributions from major donor countries are raising concerns about widening funding gaps and increasing pressures on humanitarian organizations to do more with less [6].
What This Means for MEL and Program Teams
I work with MEL and program staff every day, and the honest truth is that most project designs I see were built for a world where funding shortfalls were an edge case, not the baseline. That has to change.
Here are the approaches I think teams should be embedding right now:
1. Design Tiered Results Frameworks
Stop building logframes and results frameworks with a single scenario. Build three: a full-funding scenario, a 70% scenario, and a 50% scenario. Each tier should have its own output targets, indicator baselines, and clearly defined population coverage. When a budget cut comes mid-implementation (and it will), your team has a pre-agreed response rather than a scramble.
💡 Tip: Tiered frameworks also make donor conversations easier. When you can show exactly what $X buys versus $0.7X, you are negotiating from evidence, not panic.
2. Prioritize High-Efficiency Indicators
In a constrained environment, every indicator you track has a cost: staff time, data collection, analysis. Audit your indicator matrix ruthlessly. Ask: which indicators directly inform programming decisions? Which are tracked purely for compliance? Trim the latter. Focus your MEL budget on data that actually changes what you do.
3. Build Cost-Per-Output Tracking Into Your IPTT
If you are not already tracking cost per beneficiary or cost per output in your indicator performance tracking table, start now. When budgets tighten, you need to be able to demonstrate efficiency, not just reach. Donors under political pressure to justify aid spending will ask for this data. Teams that have it will survive funding review cycles better than those who do not.
4. Invest in Local Partnerships and Local Data Systems
Donor dependency is not only a problem at the global level. Many international NGOs have built field data systems that depend on international consultant time and expensive platforms. If your MEL system cannot function on a reduced budget, it will be the first thing cut. Building local capacity, both in staff and in tools, is a hedge against funding volatility.
5. Document Learning Explicitly for Future Proposals
In a shrinking donor pool, the organizations that win funding in competitive environments are the ones that can show what they learned and how they adapted. Systematic learning documentation, not just reporting, becomes a competitive asset. Build it into your work plans now, not as an end-of-project activity.
The humanitarian funding gap is not going to close on its own. If the structural trends hold, 2025 and 2026 will likely look worse than 2023, not better. But MEL and program teams are not powerless. Designing for constraint, tracking efficiency, and building adaptive systems are things you can start doing today.
If you want help turning any of these approaches into a practical template (a tiered logframe, a leaner indicator matrix, a cost-per-output tracker), that is exactly the kind of work I do. Come find me at vera.ignex.io.
Sources
- Falling Short? Humanitarian Funding and Reform | IASC / Development Initiatives
- Summary: 'Falling Short? Humanitarian Funding and Reform' — Défis Humanitaires
- Global Humanitarian Assistance: Crisis and Funding Response — Development Initiatives
- Humanitarian Aid's Extreme Donor Dependency Problem in Five Charts — The New Humanitarian
- A Year of Harms: The Global Impact of Humanitarian Funding Cuts on Women and Girls — Women's Refugee Commission
- Foreign Aid at a Crossroads: How Funding Cuts Reshape Global Humanitarian Response — Global Policy / Wiley
Put this into practice with Vera
Build logframes, indicators, surveys and reports in minutes — with an AI made for MEL.
Try Vera free →