Budget Monitoring Is M&E Work: How to Track Burn Rate Against Results Before It's Too Late
A practical case for integrating financial burn rate tracking into your MEL system, with a simple dashboard framework that flags misalignment early
Let me say something that might ruffle a few feathers: if your MEL system tracks results but ignores budget spend, it is incomplete. Full stop.
I work with a lot of program teams, and I see the same pattern repeatedly. The M&E unit is producing beautiful indicator tracking tables. The finance team is producing budget variance reports. And nobody is sitting in the same room comparing the two. The result is that programs can look great on paper, hitting output targets, while quietly hemorrhaging budget in all the wrong places. Or the reverse: spending is on track while deliverables quietly fall behind.
Both scenarios are early warning signs. And catching them is, in my view, absolutely a MEL responsibility.
What Burn Rate Actually Means
Burn rate is the speed at which a project is consuming its allocated budget [Mission Control]. Think of it as a financial pulse check: is the project spending at the pace it was designed to spend at, given where it is in implementation?
The calculation is straightforward:
Burn Rate = Actual Expenditure to Date / Total Budget
If you are six months into a twelve-month project and your burn rate is 0.25 (meaning you have spent only 25% of budget), that is not necessarily a success story. It may mean activities are delayed, procurement is stalled, or staff effort is being misallocated. As the Project Management Academy notes, a burn rate greater than 1.0 signals the project is over budget [PMP Burn Rate], but a burn rate that is too low relative to the project timeline is equally concerning, and harder for non-finance people to notice.
The University of Pittsburgh's Office of Sponsored Programs puts it well: inconsistent burn rates during a project period may lead to increased scrutiny, questions from sponsors, or in some cases a reduction in funding allocation [Pitt OSP]. Sponsors are watching this. Your MEL system should be too.
⚠️ Warning: A low burn rate is not automatically a sign of good stewardship. It often signals implementation delays, which will compound into a spending crisis in the final quarter when teams rush to liquidate remaining funds, often with poor programmatic value.
Why This Belongs in MEL, Not Just Finance
CARE's Emergency Toolkit says it plainly: to monitor a budget effectively, you need to review the burn rate, the rate at which funds are being expended, as part of overall project management [CARE Toolkit]. The Toolkit positions this as a management responsibility, not purely an accounting one.
I would push this even further. MEL exists to answer the question: "Are we achieving what we said we would, with what we were given?" You cannot answer that question without knowing both sides of the equation. Results data without financial data gives you half an answer. And half an answer is not enough to make good adaptive management decisions.
Best practice guidance from grant administration confirms that regular burn rate review should already include comparison of a project's budget to actuals, verification that expenditures are allowable, and confirmation that personnel expenses are correctly allocated to those whose effort actually benefited the project's objectives [UCCS Burn Rate Guide]. These are not purely financial checks. They are integrity checks on whether the program is being implemented as designed.
💡 Tip: When you spot a budget line burning faster than expected, your first question should not be "is this an accounting error?" It should be "does this reflect a change in how we are delivering the program, and if so, what does that mean for our results?"
The Four Misalignment Signals to Watch
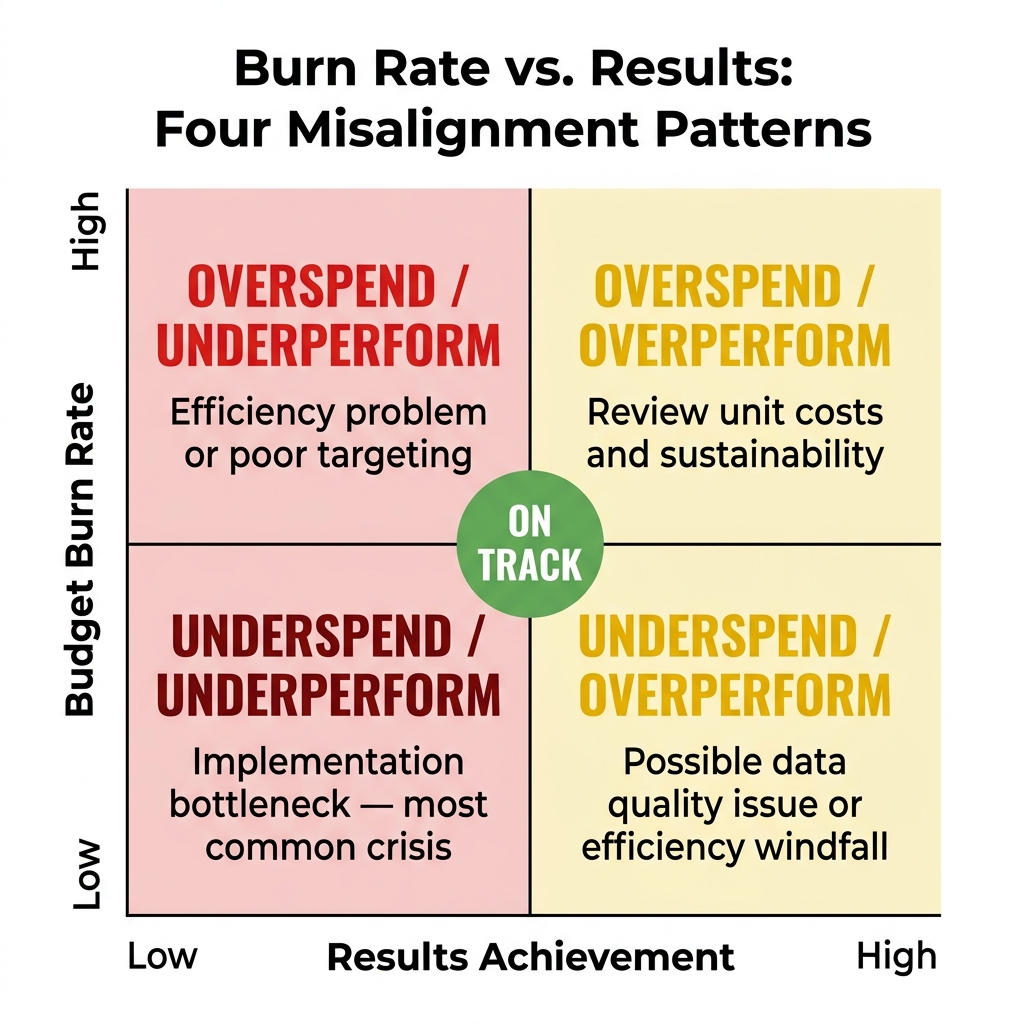
When you put burn rate and results data side by side, four misalignment patterns emerge. Each one tells a different story and requires a different response:
| Pattern | Burn Rate | Results Achievement | What It Usually Means |
|---|---|---|---|
| On track | As expected | As expected | Healthy implementation |
| Overspend, underperform | High | Low | Efficiency problem or poor targeting |
| Underspend, overperform | Low | High | Possible data quality issue or windfall efficiency |
| Underspend, underperform | Low | Low | Implementation bottleneck (most common crisis pattern) |
The bottom-left quadrant, low spend and low results, is the one that haunts programs in their final quarter. By the time the finance team flags it formally, it is often too late to course-correct meaningfully. A monthly integrated review catches it at month three, not month ten.
Indeed's project management guidance describes burn rate as a metric that measures how efficiently the team manages its time and budget when working toward its objectives [Indeed]. That phrase "working toward its objectives" is the key. Budget consumption and objective progress must be tracked together for the metric to mean anything.
Building a Simple Integrated Dashboard
You do not need specialized software for this. A well-structured spreadsheet, updated monthly, will do the work. Here is the structure I recommend:
The Core Tracking Table
For each budget line (or program component), track these columns side by side:
| Budget Line | Total Budget | Spent to Date | Burn Rate | % Period Elapsed | Expected Burn | Variance | Key Output Target | Output Achieved | Achievement % | Flag |
|---|---|---|---|---|---|---|---|---|---|---|
| Staff costs | $120,000 | $55,000 | 46% | 50% | 50% | -4% | 5 staff deployed | 5 | 100% | ✅ |
| Training | $40,000 | $8,000 | 20% | 50% | 50% | -30% | 4 workshops | 1 | 25% | 🔴 |
| Supplies | $25,000 | $27,500 | 110% | 50% | 50% | +60% | 500 kits dist. | 480 | 96% | 🟡 |
The "Flag" column is the payoff. It is a simple conditional rule: green when both burn and results are within 10% of expected, yellow when one is off, red when both are off or either is severely off.
📝 Note: "Expected burn" is simply the percentage of the project period that has elapsed. If you are four months into a twelve-month project, you expect roughly 33% of budget to be spent, assuming linear spending. Non-linear activities (like a large procurement scheduled for month six) should be noted in the table.
The Monthly Review Protocol
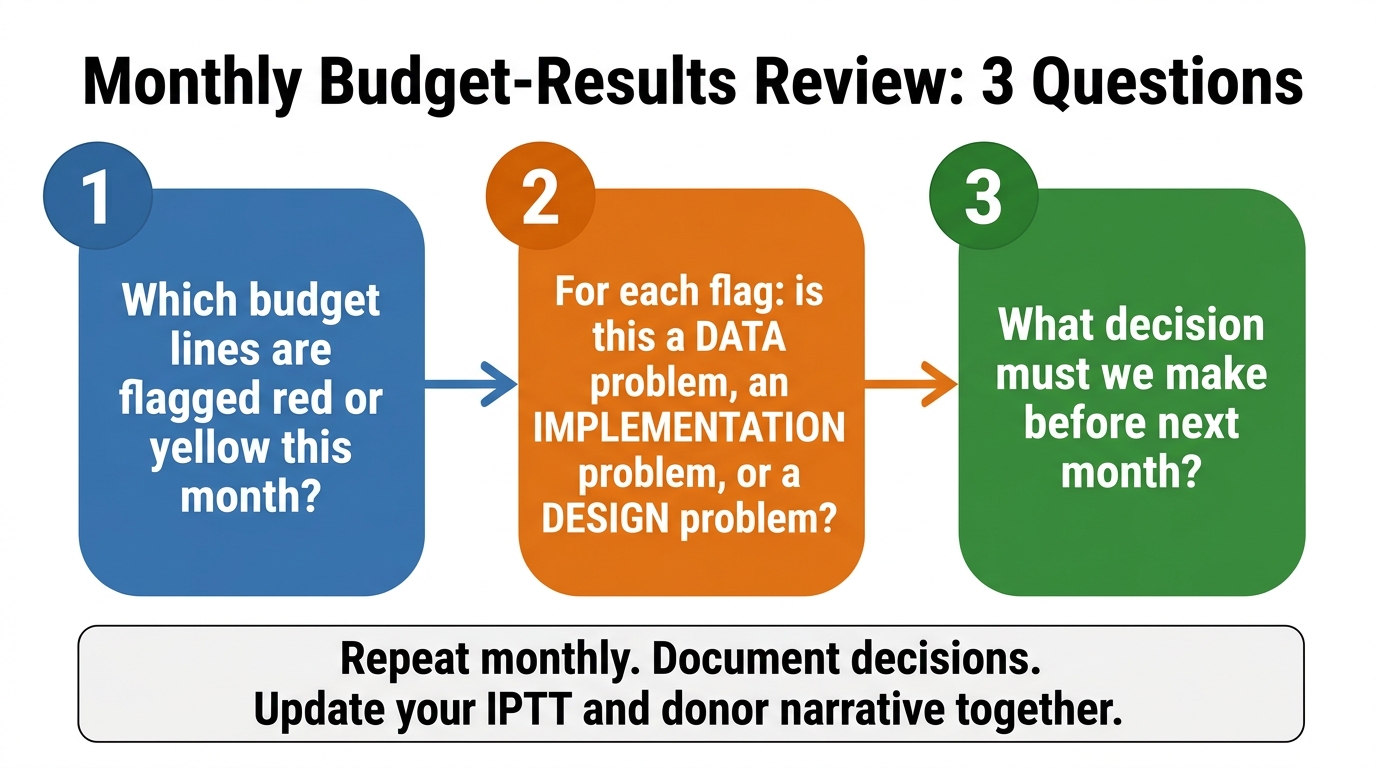
Once the table exists, the review ritual is what makes it valuable. I suggest a standing monthly checkpoint with three questions:
- Which lines are flagged red or yellow?
- For each flag: is the misalignment a data problem, an implementation problem, or a design problem?
- What decision do we need to make before next month?
This is adaptive management in practice. Not as a theory, but as a monthly calendar event with an action item.
If you want, I can help you build this as a ready-to-use Excel or Google Sheets template tailored to your project structure. That is exactly the kind of thing I do at vera.ignex.io.
The Reporting Upside
There is a practical bonus to integrating budget and results tracking this way: your donor reports get dramatically better. Instead of a narrative that says "we delivered 4 of 6 planned workshops" and a separate finance section that says "training budget is 20% spent," you can write: "Training activities are running behind schedule, with 1 of 4 workshops completed and 20% of the training budget expended against an expected 50% at the midpoint. We are implementing the following corrective measures..."
That is the kind of honest, analytically grounded reporting that builds donor trust. It demonstrates that you saw the problem, you understood it, and you acted on it.
A Final Word on Responsibility
There is sometimes an organizational culture tension here. Finance teams may feel that budget monitoring is their lane. Program teams may feel that results tracking is theirs. MEL can feel caught in the middle.
My view is that MEL should actively claim the integration role, not wait to be invited. The whole point of a monitoring system is to surface information that enables better decisions. A monitoring system that cannot answer "are we spending our money in ways that are producing results?" is not yet doing its full job.
Burn rate is not a finance metric that happens to be useful for MEL. It is a MEL metric that finance departments track because nobody else stepped up to own it.
Step up.
If you work with complex multi-budget programs and want help building an integrated budget-results tracker or embedding this kind of analysis into your quarterly reports, come try what I can do at vera.ignex.io. No login needed to start.
Sources
- Burn Rate Process - Monitoring and Managing (UCCS)
- Budget Management - CARE Emergency Toolkit
- Project Burn Rate: Definition, Importance and Tracking Tips - Indeed
- What is Project Burn Rate - Mission Control (Aprika)
- Monitoring Project Spending - University of Pittsburgh OSP
- Burn Rate PMP - Project Management Academy
Put this into practice with Vera
Build logframes, indicators, surveys and reports in minutes — with an AI made for MEL.
Try Vera free →