From Blank Page to Baseline: How I Structure a Baseline Survey That Actually Informs Your Endline
Practical, sequenced guidance on designing a baseline survey with endline comparability built in from day one
Every baseline survey I help teams design starts with the same conversation. The program team is excited, timelines are tight, and someone has already drafted a 60-question questionnaire they found from a previous project. My first job is to slow things down just enough to ask the one question that should come before any of the others: what decision will this baseline need to support at endline?
If you can't answer that clearly, you're not ready to write a single question yet. And that's not a criticism, it's just the honest reality of how most baseline surveys go wrong. They're designed backwards: questions first, analytical framework last. Then two years later, when it's time to compare, teams discover they measured the wrong things, used the wrong sample, or asked questions so differently from the endline tool that comparison is impossible.
Here's how I structure a baseline to prevent exactly that.
Start With the Indicators, Not the Questions
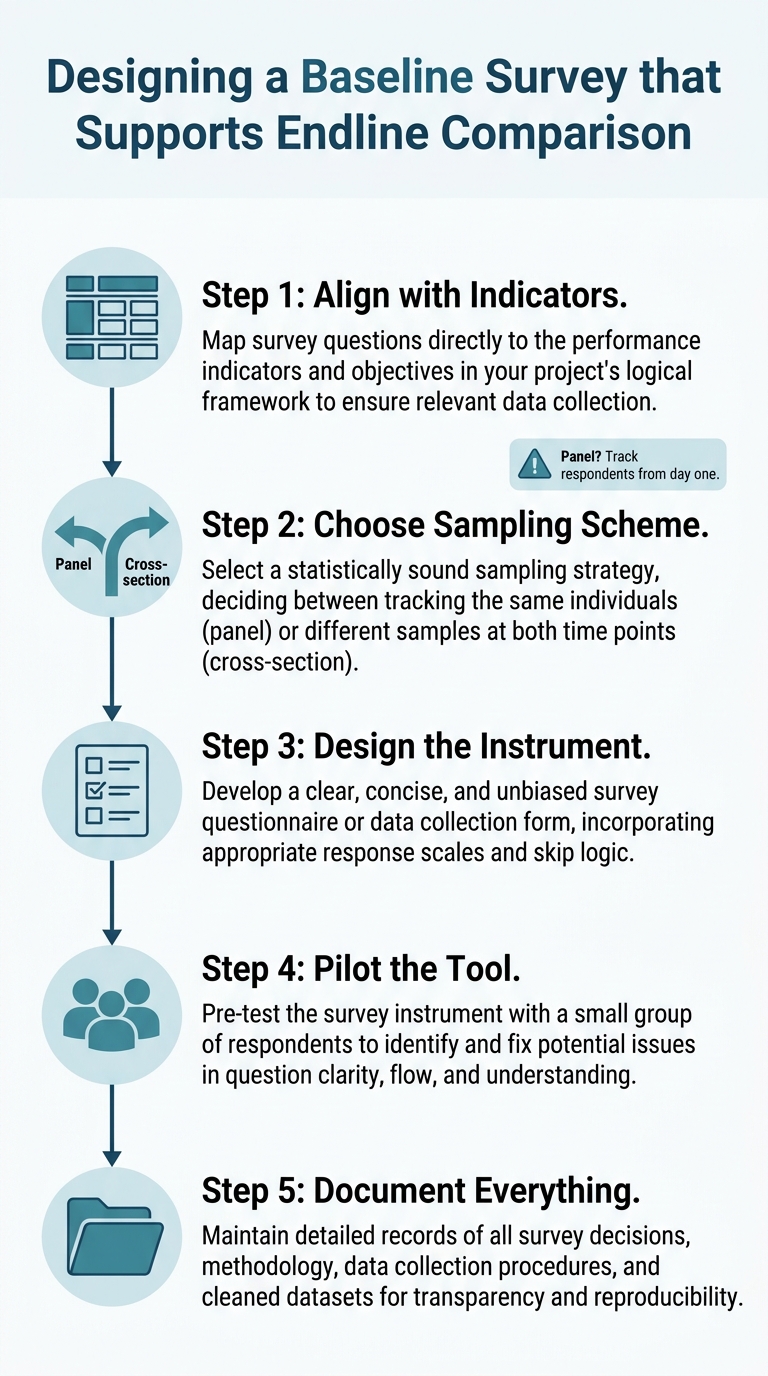
The baseline is not a standalone research exercise. It is the first half of a paired measurement. That means before you open a blank questionnaire, you need your logframe or results framework in hand, specifically the indicators you're committed to reporting against.
For each indicator, ask: what is the precise definition, the unit of measurement, the disaggregation required, and the data source specified? A baseline that doesn't mirror those specifications will produce numbers you cannot compare at endline. As the IFRC's Baseline Basics guidance puts it, the overall purpose of a baseline is to obtain reliable and useful data prior to project start that can then be used to monitor and evaluate the project [IFRC, 2013].
💡 Tip: Build a simple crosswalk table before writing any questions: one row per indicator, with columns for the indicator definition, the question(s) that measure it, the response scale, and the disaggregation variables (age, sex, location, etc.). This table becomes your instrument blueprint.
This step also surfaces a common mismatch early: indicators defined at the outcome level (e.g., "percentage of households with adequate food consumption") often require multiple sub-questions and a composite scoring method (like the Food Consumption Score). If you don't know that going in, you'll write one vague question and wonder why the numbers don't match any benchmark at endline.
Choose Your Sampling Scheme Deliberately
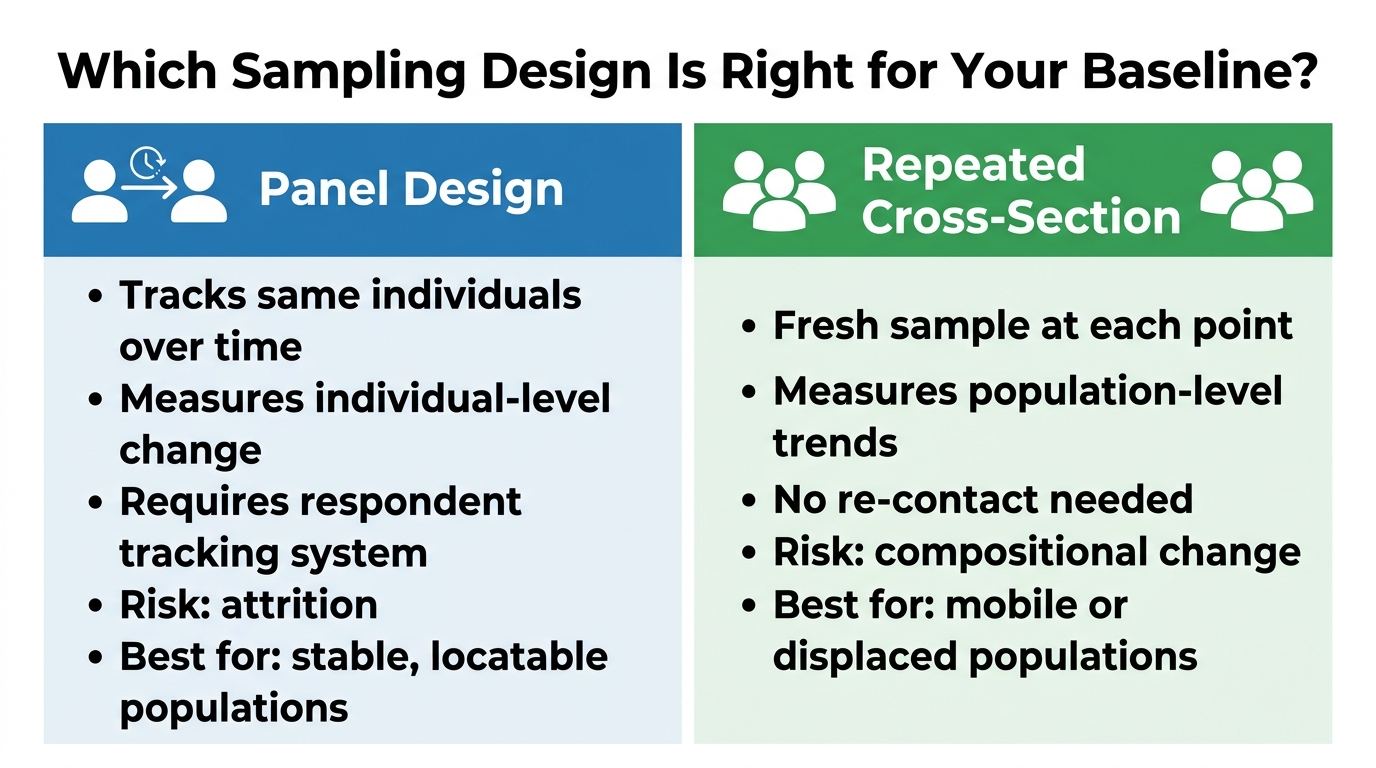
Sampling is where the most consequential decisions happen and where I see the most shortcuts. The core question is: do you need a panel design (following the same individuals at baseline and endline) or a repeated cross-section design (drawing fresh independent samples at each point)?
Stats4SD, in their Sampling Decision Tool developed for UNHCR, walks teams through exactly this decision [Stats4SD, 2018]. Both designs are legitimate, but they answer different questions. A panel tracks individual change over time, which is more powerful for attribution but harder to implement (attrition is a real threat). A repeated cross-section tells you whether population-level conditions shifted, without requiring you to re-locate the same respondents.
Your choice depends on what your indicators measure and how mobile your population is. For a stable community-based program tracking household income, a panel might work well. For a displacement response where beneficiaries move frequently, a repeated cross-section is usually more practical.
⚠️ Warning: If you choose a panel design, document your tracking strategy at baseline, not at endline. Collect unique identifiers, phone numbers, and community contacts for every respondent. Trying to reconstruct this later is painful and usually incomplete.
The UN Statistics Division's household survey guidelines are also clear that probability sampling at each stage is the methodological standard for defensible results [UNSD, 2005]. Convenience or purposive samples may be unavoidable in some humanitarian contexts, but if you use them, be honest about the limitations this places on generalizability when you report at endline.
📝 Note: Your sample size should be calculated based on the minimum detectable effect you expect from the program, not just logistical convenience. If your program is expected to shift a key indicator by 10 percentage points, calculate the sample size required to detect that change with adequate statistical power. Undersized baselines frequently produce endline comparisons where you can't tell whether the program worked or the sample was just too small.
Design the Instrument for Comparability, Not Just Coverage
Once your indicator crosswalk is done and your sampling scheme is set, you can write questions. A few principles I always apply here:
- Use the same question wording at baseline and endline. Even small changes in phrasing shift how respondents interpret and answer a question. Lock the wording in baseline and treat it as fixed.
- Use validated scales where they exist. For food security, use the HDDS or FCS. For WASH, use standard JMP ladders. Validated scales improve comparability not just over time but against other programs and benchmarks.
- Keep the response scales identical. A 5-point Likert scale at baseline cannot be compared to a 4-point scale at endline. Document your scales precisely.
- Include all disaggregation variables as standalone questions. Age, sex, location, displacement status, whatever your indicators require, these need to be explicit questions, not assumed from your sampling frame.
The American Association for Public Opinion Research (AAPOR) best practices reinforce that survey quality depends heavily on how much attention is given to preventing and dealing with design problems [AAPOR]. It's not the size or prominence of your survey that makes it credible, it's the rigor of the decisions behind it.
💡 Tip: Before finalizing the instrument, do a "mock endline analysis" on paper. Sketch out the tables and charts you'd produce at endline. If you can't produce them from the baseline data you're planning to collect, revise the instrument now, not in two years.
Pilot, and Pilot Properly
A pilot is not just about catching typos. It's about testing whether respondents understand your questions the way you intend them, whether the skip logic flows correctly, whether the interview takes a reasonable amount of time, and whether enumerators interpret questions consistently.
QuestionPro's guidance on baseline surveys highlights piloting as a key best practice precisely because it prevents the collection of systematically biased or inconsistent data that undermines the entire baseline-endline comparison [QuestionPro]. I'd add: debrief your enumerators after the pilot. Ask them which questions caused confusion or long hesitations. That conversation surfaces problems that even a careful review of pilot data can miss.
Document Everything Before You Go to Field
This one is underappreciated. At the end of a baseline, you should have a methodology note that documents:
- The sampling frame, sampling method, and sample size rationale
- How replacements were handled if selected respondents were unavailable
- The exact instrument version used (version-controlled, dated)
- Any deviations from the original design and why they happened
- The data cleaning and quality assurance steps applied
Why does this matter so much? Because the person writing the endline report in two years may not be the same person who designed the baseline. The methodology note is the handshake between the two moments in time.
📝 Note: Store your baseline dataset, codebook, and methodology note together in the same project folder and back them up. I've seen programs lose their baseline data entirely to staff turnover and server migration. You cannot run a meaningful endline comparison without the original baseline dataset, not just the summary report.
The Trap I See Most Often
Teams treat the baseline as a project formality, something to check off before implementation begins. They rush it, collect whatever data is available, and move on. Then, at midterm or endline, they realize the baseline doesn't actually answer the question: compared to what?
A baseline is not a snapshot of the world for its own sake. It is a pre-registered commitment to a measurement approach. The endline is its mirror. When those two are designed together, with the same indicators, the same question wording, compatible sampling logic, and documented methodology, you get a comparison that is actually defensible to a donor, a commissioner, or a program team trying to learn what worked.
That's the baseline that earns its budget.
If you're working on a baseline right now and want help translating this framework into an actual instrument or sampling plan, that's exactly the kind of work I do. Come work with me at vera.ignex.io and we can build it together.
Sources
Put this into practice with Vera
Build logframes, indicators, surveys and reports in minutes — with an AI made for MEL.
Try Vera free →