When Your Data Lies to You: How to Spot and Fix the Most Common Data Quality Problems in Field Surveys
A practical, field-grounded guide to catching enumerator errors, interviewer bias, skip-logic failures, and fabricated data before they corrupt your analysis
I have read a lot of datasets in my time. And if there is one thing I have learned, it is this: by the time bad data reaches your analysis, it has usually been quietly compounding for weeks. An enumerator who skips a sensitive question. A skip-logic path that nobody tested. A handful of fabricated interviews submitted on a Friday afternoon to meet a quota. Each problem alone is manageable. Together, they can hollow out the credibility of an entire baseline survey.
The good news is that most field data quality problems leave fingerprints. You just have to know where to look.
Why This Matters More Than People Admit
In 2023, over 360 million people worldwide needed humanitarian assistance, yet according to the Humanitarian Data Exchange (HDX), nearly half of field reports contained incomplete or inconsistent data [1]. That is not a rounding error. That is decisions about resource allocation, targeting, and program design being made on a foundation that is cracked.
Gartner estimates that bad data costs the average enterprise $12 to $15 million annually, and notes that figure understates the real impact, because most data quality costs are invisible, embedded in the time teams spend working around data they do not trust [5]. In humanitarian and development contexts, the cost is not just financial. It is a miscounted beneficiary list, a missed nutrition indicator, a protection gap that nobody saw coming.
The Centre for Humanitarian Data has been pushing HDX toward prioritizing data quality over data quantity for exactly this reason [4], more data is not better data. Rigor is.
The Four Problems I See Most Often
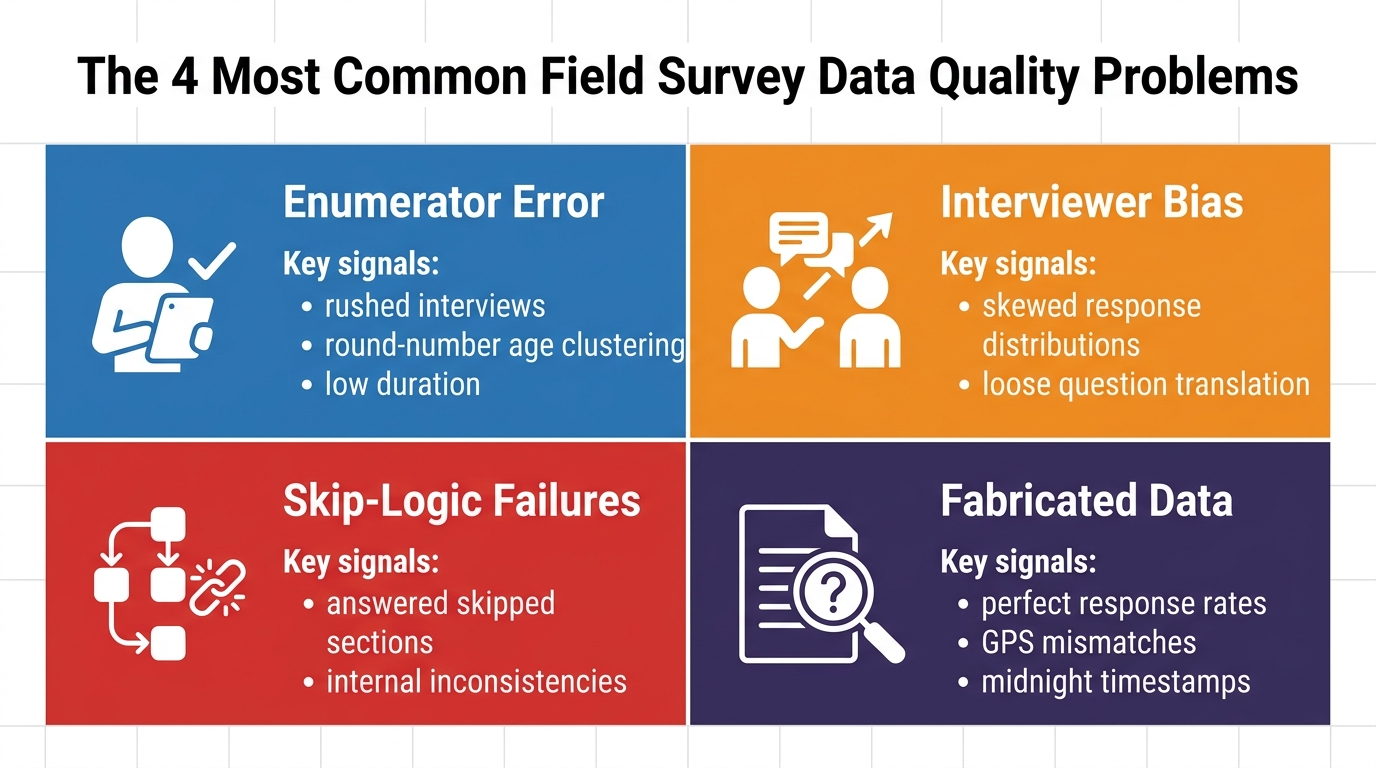
1. Enumerator Error
This is the most common and the most forgiving, because it is usually not intentional. Enumerators mishear responses, rush through sections under time pressure, misread skip instructions, or default to socially acceptable answers when a question feels awkward.
What it looks like in your data:
- One enumerator's interviews cluster suspiciously at "3" on every Likert scale
- Age distributions that look perfectly round (20, 25, 30, 35) rather than natural
- High rates of "don't know" or "refused" concentrated in a single interviewer's dataset
- Interview durations that are far shorter than the median for the team
💡 Tip: Calculate average interview duration per enumerator and flag anyone whose median is more than 20% below the team median. A questionnaire that takes 45 minutes for most enumerators and 18 minutes for one should trigger an immediate review.
2. Interviewer Bias
This is subtler and more damaging. It happens when enumerators consciously or unconsciously steer respondents toward particular answers, through leading questions, tone, or body language. It also happens when interviewers translate questions loosely in a way that changes their meaning.
The National Data Quality Forum (NDQF), developed under the Indian Council of Medical Research, explicitly identifies interviewer bias as a non-sampling error that must be measured and controlled through training, supervision, and back-checks [3, 6]. Their national guidelines treat this as a distinct quality dimension, not just a training footnote.
Concrete checks:
- Compare response distributions between enumerators for the same geographic cluster. Statistically significant differences on key indicators are a red flag.
- Conduct back-checks (re-interviews of a random 5-10% subsample) and compare key responses against originals.
- Listen to recorded interviews if your platform supports audio auditing.
3. Skip-Logic Failures
Skip logic is the scaffolding of a good questionnaire. When it breaks, respondents answer questions they should never have seen, or miss sections they definitely should have. Either way, your data becomes internally inconsistent.
⚠️ Warning: Skip-logic errors are especially dangerous because they are silent. The data looks complete, the fields are filled, but the logic that makes the data meaningful has collapsed underneath it.
SurveyCTO and similar mobile data collection platforms can enforce skip logic at the form level [2], which catches most errors during collection. But even digital tools fail when the underlying XLSForm logic has not been properly piloted. Common failure points:
- Conditions based on calculated fields that reference a variable before it is populated
- Nested skips where the outer condition is met but the inner one was not tested
- "Other (specify)" branches that route correctly on one platform but not after export
The fix: Pilot every skip path deliberately. Do not just run through the questionnaire normally, test each branch explicitly, including edge cases like "refused" and "don't know."
4. Fabricated Data
I will be direct: data fabrication happens. It happens when enumerators face impossible targets, when field conditions make genuine data collection dangerous or impractical, and when there is no verification mechanism to catch it.
The fingerprints of fabricated data are surprisingly consistent:
- Perfect or near-perfect response rates for a particular enumerator
- Responses that cluster at the midpoint of scales with almost no variance
- Geographic coordinates that do not match the claimed interview location (always check GPS metadata)
- Timestamps showing interviews "conducted" at 2 a.m., or five interviews completed in twenty minutes
- Household compositions that repeat across interviews (same number of children, same asset patterns)
📝 Note: The NDQF national guidelines recommend a structured data profiling step immediately after each data collection wave, before any cleaning begins [3]. This is the moment to catch fabrication, not after you have already run your analysis.
A Practical Pre-Analysis Checklist
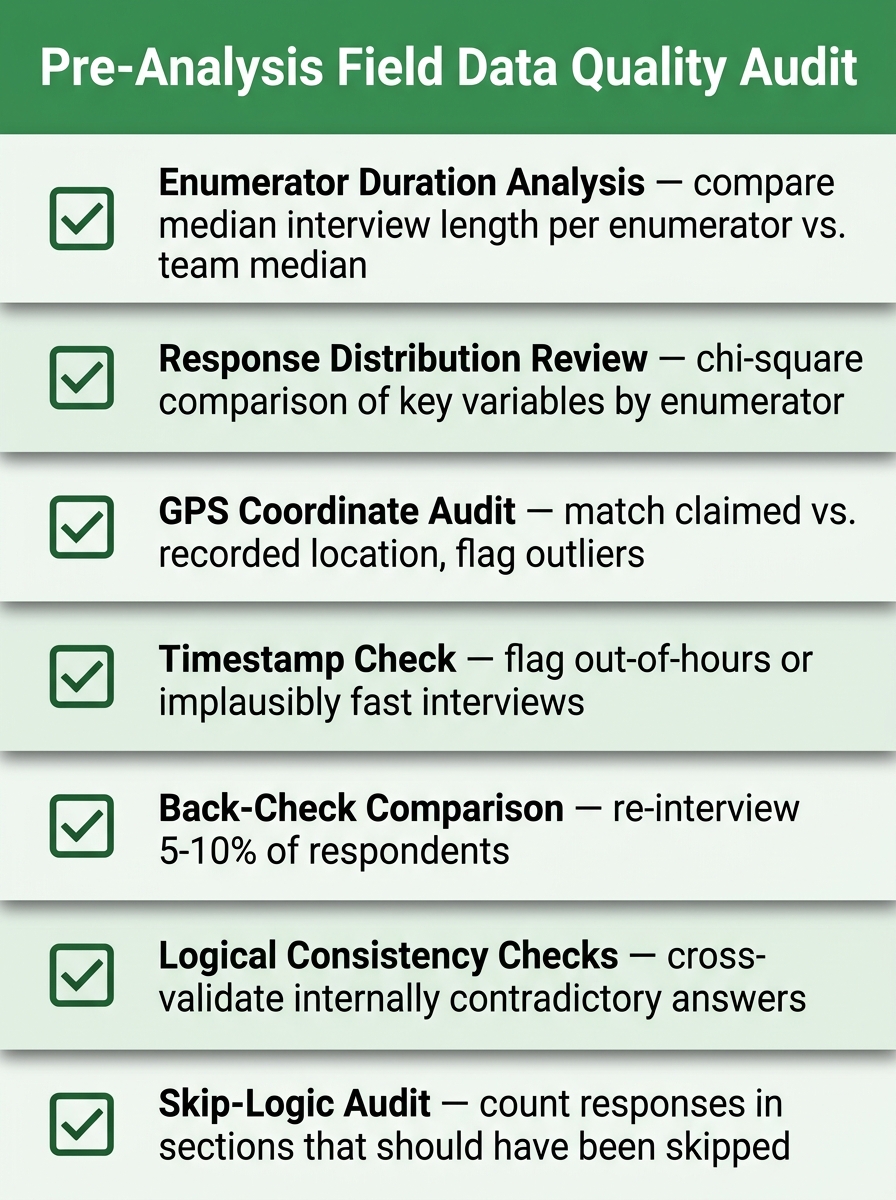
Here is the basic quality audit I would run on any field dataset before touching the analysis:
| Check | What to look for | Tool |
|---|---|---|
| Enumerator duration analysis | Median interview length per enumerator vs. team median | Excel / R / Python |
| Response distribution by enumerator | Chi-square or visual comparison of key variable distributions | R / SPSS / Stata |
| GPS coordinate review | Match claimed location vs. recorded coordinates; flag outliers | QGIS / Google Earth |
| Timestamp audit | Flag interviews outside working hours or implausibly short gaps between interviews | Excel |
| Back-check comparison | Re-interview 5-10% of respondents; compare key answers | ODK / SurveyCTO back-check module |
| Logical consistency checks | Cross-validate internally inconsistent responses (e.g. age vs. schooling level) | R / Python / Stata |
| Completeness by section | Calculate % missing per section per enumerator | Any stats tool |
| Skip-logic audit | Count responses in sections that should have been skipped | Form-level validation |
💡 Tip: Run this audit the day data comes in from the field, not the week before your report is due. Early detection means you can send enumerators back for corrections while the field team is still deployed.
Building Quality In, Not Just Checking It After
The most efficient place to prevent data quality problems is before and during collection, not after. The SurveyCTO guidance on field research data quality emphasizes that digital data collection tools provide a structural advantage here: built-in range checks, required fields, and skip-logic enforcement catch errors at the point of entry [2].
But technology is not a substitute for preparation. The NDQF guidelines identify enumerator recruitment and training as a core quality dimension, not just a logistical step [3]. Enumerators who understand why a question is being asked, and what good data looks like, make better judgment calls in the field than enumerators who are just reading a script.
A few structural habits that pay off:
- Conduct a thorough field pilot covering all skip paths and edge cases, with debriefs from enumerators afterward.
- Assign a field supervisor for every 4-6 enumerators, with a structured daily review protocol.
- Set up real-time dashboards (most mobile platforms support this) so you can spot anomalies while the field team is still reachable.
- Define your quality thresholds in advance: what percentage of back-check discrepancies triggers an enumerator re-training or dismissal? Write it down before you start.
- Document everything: the NDQF guidelines make documentation of quality processes a formal requirement, not optional [3]. If you cannot show your quality assurance process, the data's credibility is compromised regardless of how clean it actually is.
If you are building out your data quality protocols and want a head start on the templates and frameworks, I am always happy to help turn these into ready-to-use tools. That is exactly the kind of work I do at vera.ignex.io.
The Mindset Shift That Changes Everything
The real problem is not that field data quality issues are hard to detect. Most of them are not, once you know what to look for. The real problem is that teams tend to treat data quality as something to worry about after collection is over.
Flip that. Treat every day of data collection as a quality event. Review the previous day's submissions each morning. Flag anomalies while you can still correct them. Build a culture where enumerators know that their data is being reviewed, not to punish them, but because the work matters.
Data that lies to you does not announce itself. It just quietly shapes every decision that follows. The teams that catch it are the ones that were looking.
Sources
- How to Improve Data Quality for Humanitarian Efforts
- How to Ensure Data Quality in Field Research - SurveyCTO
- National Guidelines for Data Quality in Surveys (NDQF/ICMR)
- Quality Measures for Humanitarian Data - The Centre for Humanitarian Data
- Data Quality Issues: 6 Solutions for Enterprise Organizations - Actian
- National Guidelines for Data Quality in Surveys: An Overview (PMC/ICMR)
Put this into practice with Vera
Build logframes, indicators, surveys and reports in minutes — with an AI made for MEL.
Try Vera free →