The PDM Trap: Why Post-Distribution Monitoring Is Broken (and How to Fix It)
Designing PDM that generates actionable evidence, not just compliance paperwork
I've reviewed a lot of PDM reports. And I'll be honest: too many of them tell the same story. Pages of pie charts showing that 87% of recipients were "satisfied." A table confirming items were received. A handful of quotes from beneficiaries praising the programme. Then nothing happens.
The next distribution runs the same way it always has. The same questionnaire goes out. The same charts come back. The donor gets their annexes. The report goes into a shared drive folder no one opens again.
That's the PDM trap, and it's more common than anyone in humanitarian programming likes to admit.
What PDM Is Actually Supposed to Do
Let's start with the definition, because it matters. According to UNHCR's microdata catalogue, PDM is "an exercise conducted independently from the distribution itself, designed to collect information related to the objectives of the distribution" [1], including access to basic needs, coping strategies, spending habits, and shelter adequacy. The M&E Specialist describes it even more precisely: a PDM survey "collects information on the distribution process, timeliness, relevance, use and impact of the assistance distributed, and satisfaction of the recipient populations" [2].
Read that again. Timeliness. Relevance. Use. Impact. Satisfaction. Five distinct dimensions of performance. A good PDM is not just a receipt confirmation. It's a diagnostic tool, one that, if designed well, tells you whether the assistance actually worked and what to do differently next time.
📝 Note: PDM surveys should only include programme participants, not the general population. Since questions focus on the distribution process and assistance received, non-recipients are not a relevant comparison group [2].
The trouble is that organisations often collapse all five dimensions into a single satisfaction score, lose the nuance, and report the average. That average almost always looks acceptable. Which is exactly why nothing changes.
Where PDM Design Goes Wrong
People in Need's technical guidance on PDM for shelter programming [3] offers a useful framework for thinking about where the wheels come off. The document covers timing, methodology selection, sampling strategy, enumerator training, analysis, and utilisation of findings. That's a sophisticated pipeline. Yet in practice, most organisations shortcut every single stage.
Here's what that shortcutting looks like:
- Timing: PDM is conducted too soon after distribution (before items are used) or too late (after the context has shifted so much that responses are no longer attributable to the assistance).
- Tool design: Questionnaires are copied from a previous project, often from a different sector or geography, with minimal adaptation. Questions measure what's easy to ask, not what's hard to know.
- Sampling: Convenience sampling replaces proper probability sampling. The enumerators interview whoever is available near the distribution point, introducing systematic bias toward certain household types.
- Analysis: Descriptive frequencies are calculated and reported without disaggregation by gender, age, disability status, or household type. Patterns stay hidden.
- Utilisation: Findings are written into a report but never formally fed back into programme design, procurement decisions, or targeting criteria.
⚠️ Warning: A PDM with a biased sample is not just uninformative, it's actively misleading. Satisfaction rates calculated from convenience samples consistently overstate programme performance because the households hardest to reach (remote, mobility-impaired, female-headed) are systematically underrepresented.
The Closed-Loop Problem
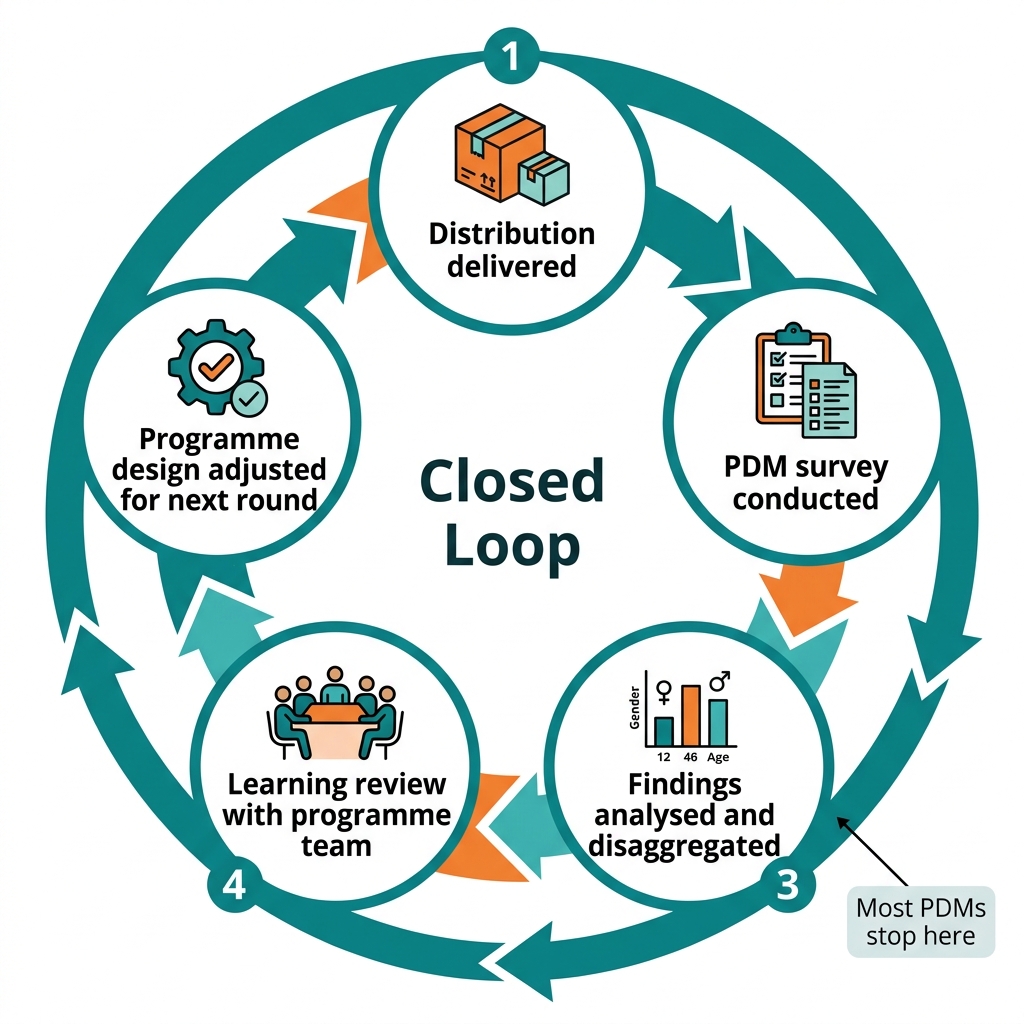
There's a concept from medical device regulation that I find genuinely useful here. An article on post-market surveillance in the medtech sector [4] describes what they call "closed-loop" models: systems that "continuously evaluate whether corrective actions successfully reduced risk... over time" rather than stopping at investigation completion. The best systems, the article notes, "trigger enhanced monitoring criteria, targeted updates, and design review activities before widespread field escalation occurs."
That framing maps almost perfectly onto what humanitarian PDM should be but rarely is. A closed-loop PDM system would look like this:
- Findings from PDM Round 1 feed explicitly into the design of the next distribution.
- The next PDM round includes questions that test whether those design changes worked.
- Changes in indicator scores over time are tracked, not just reported in isolation.
- When a corrective action doesn't move the needle, it triggers further investigation rather than being quietly dropped.
Most PDM systems are open-loop: they generate findings, publish a report, and stop. The feedback never actually closes.
💡 Tip: Build a simple "learning log" alongside your PDM. For each major finding from the previous round, document what programme adjustment was made and include at least one question in the next round to test whether that adjustment worked.
Designing PDM That Actually Generates Evidence
So what does good PDM design look like? Drawing on People in Need's guidance [3] and the real-world example from the SUFAL II anticipatory action programme in Bangladesh [5], here are the principles I'd apply:
1. Anchor your questions to your objectives
Your PDM tool should trace directly back to the distribution's theory of change. If the goal was to reduce negative coping strategies, you need questions that measure coping strategies, not just satisfaction with item quality. If the goal was to meet a Minimum Expenditure Basket, you need to ask how the cash or in-kind assistance was actually spent.
2. Disaggregate by design, not as an afterthought
Gender, age, disability status, and household type should be built into your sampling frame and your analysis plan from day one. The Bangladesh PDM report [5] includes disaggregation for persons with disabilities (PWDs) as a named category, which allowed the team to identify differential access patterns that an aggregate satisfaction score would have completely obscured.
3. Time it right
People in Need recommends considering "timing" as a primary design variable [3]. For in-kind distributions, this generally means waiting long enough for items to be used (two to six weeks for most NFIs) but not so long that recall fades or the household situation has changed significantly. For cash or voucher assistance, timing should align with expected expenditure cycles.
4. Mix your methods
Household surveys give you quantitative coverage. Focus group discussions and key informant interviews give you the "why" behind the numbers. A high dissatisfaction rate on item quality means nothing until you understand whether it reflects a procurement failure, a cultural mismatch, a warehousing problem, or something else entirely. The PDM guidance from People in Need explicitly includes FGD and KII guides as standard annexes for this reason [3].
5. Build the utilisation pathway before you collect a single data point
This is the one most teams skip. Before the survey goes live, document: Who will receive the findings? What decisions are they authorised to make? What is the timeline for those decisions relative to the next distribution? If you can't answer those questions, your PDM will generate a report, not evidence.
💡 Tip: Schedule a "findings utilisation meeting" in your project calendar at the same time you schedule the data collection. The meeting should be attended by the programme team, not just the MEAL team.
A Practical PDM Quality Check
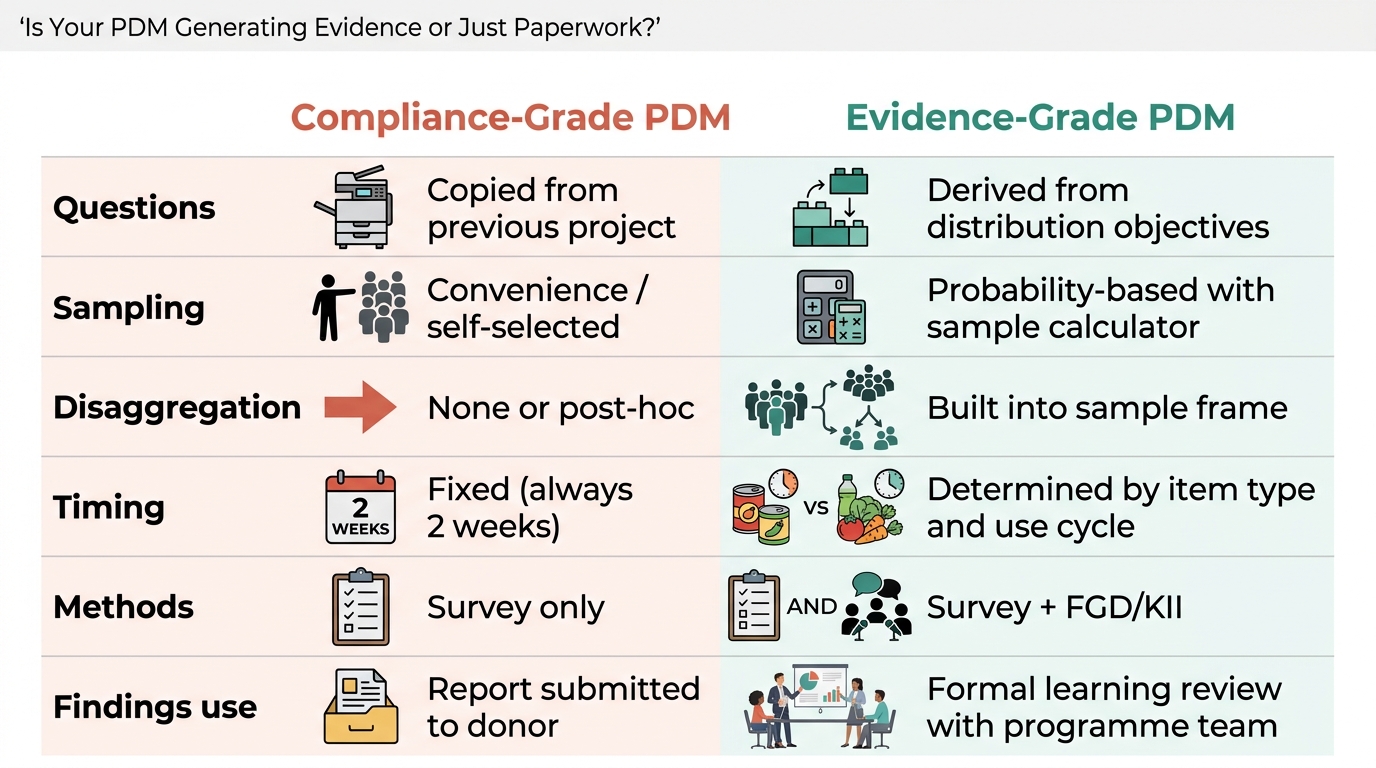
Use this table as a quick check before you finalise your PDM design:
| Design element | Compliance-grade PDM | Evidence-grade PDM |
|---|---|---|
| Question source | Copied from previous project | Derived from this distribution's objectives |
| Sampling method | Convenience / self-selected | Probability-based, with sample calculator |
| Disaggregation | None or post-hoc | Built into sample frame and analysis plan |
| Timing | Fixed (e.g. always 2 weeks) | Determined by item type and use cycle |
| Methods mix | Survey only | Survey plus FGD/KII for key dimensions |
| Findings use | Report submitted to donor | Formal learning review with programme team |
| Longitudinal tracking | None | Scores tracked across rounds |
If your PDM ticks the left column on more than two rows, it's worth pausing to redesign before you go to field.
If you're building or rebuilding a PDM tool and want something that's actually structured to generate evidence rather than just satisfy a reporting requirement, that's exactly the kind of work I do. Head over to vera.ignex.io and let's build something that closes the loop.
PDM doesn't have to be a compliance exercise. Designed well, it's one of the sharpest learning instruments in the humanitarian toolkit. The populations we serve deserve programmes that get better over time, not just programmes that get reported on time.
Follow Vera for more on MEL & project management: LinkedIn · Instagram · Facebook · X
Sources
- UNHCR Microdata Catalogue: Post Distribution Monitoring
- What is Post-Distribution Monitoring? - The M&E Specialist
- Post Distribution Monitoring for Shelter Programming (People in Need)
- From Compliance to Clinical Action: Fixing the Broken Loop in Post-Market Surveillance - MedTech Intelligence
- Post Distribution Monitoring (PDM) Report - SUFAL II, Anticipation Hub
Put this into practice with Vera
Build logframes, indicators, surveys and reports in minutes — with an AI made for MEL.
Try Vera free →